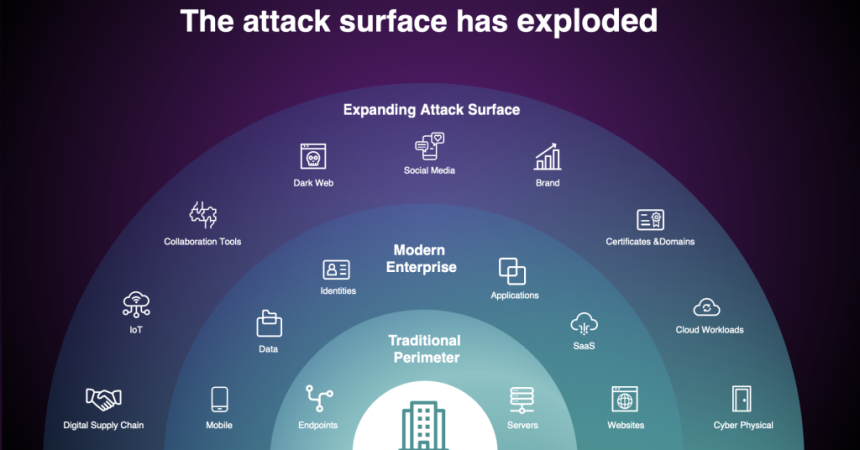
Attack surface management (ASM) is a proactive discipline that treats an organization’s entire technology footprint as the adversary sees it – continuously discovering and assessing every possible entry point or vulnerability an attacker could exploit. Technically, the attack surface is the sum of all exposed assets, services, and code paths that could allow unauthorized access or data exfiltration. Historically this began with network perimeters and visible servers, but it has evolved into a multi-dimensional concept encompassing on‑premises and cloud networks, APIs, mobile devices, IoT, third‑party services, and even human/social channels. In modern practice the attack surface is often divided into sub-surfaces: digital (networks and systems), physical (endpoints, USBs, printers, etc.), and social engineering (user behavior). As one report notes, “as organizations increasingly adopt cloud services and hybrid work models, their attack surfaces become larger and more complex”. Indeed, a recent survey found 67% of organizations saw their attack surface grow in the last two years as new cloud assets and remote endpoints proliferate.
An attack surface can be illustrated as layered domains of risk. For example, one can imagine a concentric diagram: at the core are critical data and high‑value servers, around them exposed interfaces (databases, application APIs, admin consoles), and on the outer rings the broader network (VPN gateways, Wi-Fi, IoT, SaaS integrations). Each layer adds potential vulnerabilities. Modern ASM therefore goes beyond static inventories, treating the entire enterprise – on‑prem, cloud, development pipelines, and even business processes – as a live, changing target that needs mapping and pruning.
Shadow IT: Orıgıns, Rısks, and Detectıon
Shadow IT refers to any hardware, software or service used by employees without official IT approval. It emerged with easy SaaS adoption and BYOD policies: employees self-provision cloud apps (e.g. unsanctioned messaging, file-sharing, or CRM tools) because they “just work” or speed up tasks. This unauthorized tech can be anything from personal devices like USB drives and phones to free software tools to any “unknown” endpoint on the corporate network. Shadow IT can help you get more done, but it also puts your security and compliance at risk. Because of this, central security teams don’t keep an eye on these assets, so they often have unpatched vulnerabilities, weak or default credentials, and no logging. Data stored in shadow systems can leak or be exfiltrated unnoticed. As IBM puts it, shadow IT often “introduces serious vulnerabilities that hackers can exploit”. Regulatory violations (e.g. uncontrolled PII transfer to unsanctioned clouds) are also common.
Detecting shadow IT is thus crucial but challenging. Regular asset inventories and network scans, which are common ways to find devices, often miss devices that are hidden, not on the corporate domain, or behind SSL tunnels. Advanced detection uses passive monitoring and analytics on the company’s logs and traffic. For example, if you put together DNS queries, NetFlow/IPFIX, or proxy logs and compare them to a list of apps that are allowed, you might see patterns in how people use services that aren’t allowed. Machine learning that doesn’t need supervision can separate normal traffic from strange traffic in firewall or network logs. When people are using shadow SaaS, they often point to suspicious groups. A new study found that clustering algorithms like K-Means and statistical outlier detection could be used to find unauthorized SaaS instances in firewall logs with different levels of risk. You can also find rogue devices without looking at user content by looking for strange MAC addresses or hostnames in DHCP and Active Directory logs.
Another way to find out what’s going on is through endpoint telemetry. EDR agents or MDM tools can be used to report on all the software installed on company devices and flag any apps that aren’t allowed. If you see sensitive files suddenly show up on unknown web services, data loss prevention (DLP) logs can help you find shadow file-sharing tools. The main goal is to find illegal IT patterns, not to spy on workers. Setting traps is a common tactic. For example, you could set up fake internal hostnames or decoy network services and then let people know if they connect to them. This “honeypot” style detection can expose intent without needing to inspect private data.
In practice, effective shadow IT detection combines multiple signals: network flows, asset fingerprinting, cloud API audits (e.g. listing active service accounts), and even user surveys. And once discovered, shadow IT assets must be triaged: some may be quickly sanctioned (by applying corporate security controls), others blocked or decommissioned. Throughout, clear communication and security training are vital, since shadow IT ultimately stems from legitimate user needs. Establishing a rapid request/approval workflow for new tools can often turn a stealthy shadow IT problem into a collaborative security solution.
Hybrıd/Multı‑Cloud Challenges
Attack surface management in a hybrid or multi-cloud environment introduces new complexities. Each cloud platform has its own APIs, identity model, and ephemeral resources, making unified discovery difficult. Cloud instances spin up and down on demand, container workloads come and go, and serverless functions have short lifespans. This “dynamic elasticity” means assets are constantly in flux, challenging any static inventory. Moreover, misconfigurations in cloud configurations (open storage buckets, overly permissive IAM roles, exposed serverless endpoints) dramatically increase exposed attack vectors. The classic network perimeter melts away when applications stretch across on-prem data centers, public clouds, and remote devices.
A hybrid setup also introduces visibility gaps. Traffic moving east-west inside a cloud network may not traverse on-prem security monitoring points. Cloud-native networks often rely on APIs instead of traditional network scanning (for example, querying AWS or cloud-hosted Kubernetes APIs for assets). Furthermore, multi-cloud means different security policies or naming conventions, creating blind spots if any one cloud is not fully integrated into the ASM process. For instance, a forgotten test environment in one cloud region might remain unmonitored if not correctly onboarded.
Inter-cloud connectivity (VPNs, transit gateways, service meshes) also broadens the surface: a compromise in one cloud could give lateral access to others. The shared responsibility model in the cloud shifts some perimeter defenses (like patching and hardening) onto the customer. And on-prem assets must now be viewed in the context of their cloud exposures (e.g. on-prem identity servers reachable from cloud).
In summary, hybrid/multi-cloud ASM demands unified discovery tools that talk to every environment, and correlation of identity and asset metadata across domains. For example, associating a cloud VM and an on-prem server under one logical service or business function can reveal that a vulnerability in the VM also endangers on-prem data. Effective ASM frameworks now often include an “enterprise exposure graph” – a directed graph linking assets, identities, network paths and vulnerabilities – that spans all clouds and sites. Although no widely published standard exists for this graph, some teams build their own by harvesting data from cloud APIs, orchestration logs, and DNS records, then use graph analysis to identify the most critical attack paths.
Metrıcs and Vısualızatıon of Attack Surfaces
Measuring the attack surface is inherently approximate, but metrics help focus efforts. Useful technical metrics include counts of assets and exposures, weighted by risk:
- Total Number of Assets. Counting all “internet-facing” or critical hosts and services provides a baseline of surface size. This includes domain names, IP ranges, cloud accounts, on-prem servers, network devices, etc. A sudden spike in discovered assets usually warrants investigation (it could indicate a new environment or a misconfiguration).
- Total Number of Vulnerabilities. Aggregate the count of known CVEs across all assets, whether patched or unpatched. This combines with asset count to give a rough “threat breadth”.
- Average Vulnerability Score. Compute the mean CVSS (or EPSS) score of all vulnerabilities. A high average means more severe weaknesses. This single number helps communicate risk succinctly.
- Vulnerability Distribution. The breakdown of vulnerabilities by severity (critical, high, etc.). Visualizing this (e.g. a bar chart of counts per severity) quickly shows if critical issues dominate.
- Open Security Issues Trend. Track open tickets or backlog vulnerabilities over time. A stable or shrinking curve indicates effective remediation; a rising one signals trouble.
- Known Exploited Vulnerabilities. Count how many assets have vulnerabilities listed in threat intelligence (such as CISA’s known-exploited catalog). These are especially urgent.
- Affected Asset Count per Vulnerability. For each critical flaw, how many systems are impacted. High-impact vulnerabilities touching many hosts get top priority.
- New Asset Discovery Rate. How many new external or high-privilege assets appear in a given period. Abnormal bursts can indicate shadow deployments or attacks.
Together, these metrics can be combined into dashboards. For visualization, a common practice is to draw an attack surface map or graph. One might create a network diagram highlighting all externally reachable subnets and their services, annotated with color codes for risk (e.g. red for critical unpatched ports). Attack path analysis can also be depicted: for example, a graph showing user endpoints to servers to databases, with arrows showing exploit chains. Heatmaps and tag clouds (e.g. showing most common open-port numbers or top vulnerable services) can reveal patterns at a glance. Some teams even construct a 3D “risk matrix” where axes are number of assets, average severity, and rate of change – helping to spot outliers.
In practice, metrics should align with risk appetite. For instance, if zero trust is a goal, one might weight exposed interfaces more heavily. A custom Attack Exposure Index (AEI) could be defined, for example:
AEI = Σ_{asset} ( openPorts(asset) × vulnerabilityScore(asset) × criticalityWeight(asset) )
which yields a single “attack surface score” for the organization. While highly dependent on how “criticalityWeight” is set (business impact, data sensitivity, etc.), it encourages quantification. Regardless of the formula, visualizing these metrics over time and correlating them with incidents is key. Often we say “you can’t secure what you can’t see” – well-crafted metrics and live dashboards provide that necessary visibility.
Contınuous Asset Dıscovery and Classıficatıon Framework
A robust ASM program treats asset discovery as a continuous process. A recommended internal framework might look like this:
- Define Scope and Priors. Establish what counts as a critical asset (e.g. crown jewels, internet-facing services). Import existing inventories (CMDB, IAM directory, cloud account lists) as seed data.
- Automated Discovery Loop. Implement both active scanning and passive monitoring in cycles. Active tools (Nmap, masscan, web-subdomain scanners, cloud API calls) systematically probe networks and domains to find live hosts and services. Meanwhile, passive collection (flow logs, DNS analytics, agent telemetry) runs in real time to catch anything the scan misses. For example, a Python-based engine might:
- while True:
assets = set()
assets |= run_active_scan(vpn_cidr_range)
assets |= query_cloud_inventory(api_keys)
assets |= parse_netflow_logs(next_hour_of_data)
for asset in assets:
if asset not in asset_db:
classify_new_asset(asset)
add(asset)
sleep(scan_interval)
- Classification and Tagging. Every discovered asset is enriched with metadata: role (web server, database, IoT sensor), owner (dev team, business unit), environment (prod, dev), data sensitivity, and connectivity (external-facing, internal-only). This can be semi-automated: for instance, a discovered IP might be matched against known CIDR blocks or Terraform inventories to assign owner tags. Vulnerability scanning results and patch status are also recorded.
- Continuous Update and Purge. The system should timestamp each asset report; stale entries (e.g. IPs no longer responding) are marked inactive. Conversely, new assets trigger alerts. This ensures the inventory stays current and prunes orphaned or decommissioned systems.
- Governance and Workflow. Define processes for what to do when new assets or risks are found. For example, if a new public IP with RDP open is discovered, automatically create a high-priority ticket for review. A monthly “attack surface review” meeting between SecOps, network, and app teams can validate findings and decide on remediations or acceptances.
Throughout, security teams should integrate human oversight. Automated tools can tag and score everything, but regular audits (including manual pen tests or threat hunts) help catch what tools miss. The classification schema itself should be reviewed by stakeholders (e.g. business units may adjust what they consider “critical” data).
A unique perspective is to treat ASM akin to DevSecOps for infrastructure. Just as code pipelines enforce scanning on every commit, asset pipelines can enforce checks: when a new server is spun up, a “discovery event” should automatically register it in ASM before it is considered production. Enforcing that each resource (cloud VM, container, VLAN) must include an ASM agent or tagging at creation prevents shadow assets. Over time, this embeds ASM into the organization’s change management.
Integratıng ASM ınto Securıty Operatıons (SIEM/SOAR)
Attack surface data should feed directly into security operations. For instance, discovered asset information can enrich SIEM events and correlation rules. When the SIEM processes a network alert, it can look up the asset in the ASM repository to see its classification, vulnerability score, and owner. This context greatly aids triage: an alert on a high-exposure asset (publicly facing, critical database) will be treated more urgently than the same alert on an isolated dev machine. In practice, this means pushing ASM data (asset ID, tags, risk score) into the SIEM’s CMDB or asset table, ensuring all logs have this contextual layer.
Furthermore, ASM findings can trigger SOAR playbooks. For example, a SOAR rule could be: “If a new internet-facing host is detected with a critical unpatched CVE, automatically isolate it in the firewall and open a ticket.” This requires the ASM system to publish events to the security pipeline (via webhook or message bus). Pseudocode for a SOAR integration might look like:
on_event(ASM.DiscoveredAsset):
if asset.is_external and asset.vulnerabilities.max_score >= 9.0:
SOAR.alert(“Critical unpatched external asset”, asset.id)
SOAR.action(“isolate_asset_in_firewall”, asset.id)
ticketing.open(“Patch or decommission ” + asset.id)
Even without full automation, simply having a daily ASM report into the SIEM of all exposed assets (with labels of new/changed) is useful for analysts. It can be searched and visualized in the SIEM console. Some teams even correlate ASM data with user and endpoint telemetry: for instance, cross-referencing “suspicious login on 10.1.2.3” with “asset 10.1.2.3 was flagged as orphaned and unpatched last week” can quickly raise a critical incident.
Beyond tool integration, ASM should be embedded in processes. For example, red team exercises should use the ASM inventory as their starting point (i.e. attackers use the same asset list). And blue teams should measure detection metrics with ASM context (e.g. “time to detect a new asset’s malicious activity”). The goal is a feedback loop: ASM identifies risks, SOAR/SIEM detects exploitation attempts, and outcomes feed back into refining ASM priorities and scope.
Human Factors and Rogue IT: Non‑Invasıve Detectıon
While tools cover technical surfaces, the human element remains an unpredictable part of the attack surface. Rogue or careless behaviors (installing unapproved routers, using personal email for business, falling for phishing) can create hidden vulnerabilities. We stress non-invasive strategies for managing this:
- Network Segmentation and NAC. Enforce strict network controls so any unknown device lands in a quarantined segment with limited connectivity. The network access control (NAC) system can require authentication or device checks. If an unrecognized laptop plugs in, it gets isolated by default. This way rogue devices become visible anomalies rather than silent holes.
- Anomaly-based Monitoring. Rather than spying on individuals, use aggregate metrics: spikes in unique devices on Wi-Fi, large uploads to unsanctioned cloud services, or sudden browsing of forbidden categories can be flagged. For example, if a user’s work account suddenly accesses a foreign code repository they never used before, that transactional anomaly indicates potential shadow IT.
- Policy Automation. Make it easy to comply so there’s less need to sneak around. For instance, provide a quick self-service portal for requesting new cloud storage; if approval is automated and fast, employees are less likely to use rogue file-sharing services.
- Behavioral Analytics with Privacy. Some advanced systems can detect rogue IT by looking at patterns (device fingerprinting, software hashes) without tying them to individuals. For example, a database of “known good” hardware MAC addresses or SSL certificate pins can alert if an unfamiliar device claims an internal identity.
- Education and Incentives. Finally, cultivate a culture where employees want to follow process. If staff understand the risks of shadow IT, and if reporting a new tool is painless (and even rewarded by IT support), the incidence of rogue IT can drop.
In essence, the goal is to detect infrastructure anomalies (extra laptops, unknown network traffic, unsanctioned endpoints) rather than surveilling people’s communications. This aligns with the attack surface mindset: treat unauthorized behavior as yet another “asset” to find, rather than a secret. For example, every VPN login from an unknown device or location could automatically flag that device for ASM scanning. A mature program may even enlist deception – baiting employees with fake offers of a productivity app and tracking who installs it – turning the human factor into a detection mechanism.
Conclusıon
Managing the attack surface and shadow IT in today’s complex environments demands a blend of continuous automation, clever analytics, and strong processes. Cybersecurity professionals must think like attackers: mapping every potential path, from exposed API endpoints to an employee’s rogue smartphone, and then systematically closing or monitoring those paths. This involves technical rigor (scanning, metrics, integration) and organizational ingenuity (governance frameworks, user education). Unique approaches – such as custom exposure indices, graph-based asset modeling, and non-intrusive behavioral triggers – can give a security program an edge beyond standard toolsets.
In the end, a high-level ASM strategy integrates deep technical discovery with contextual intelligence and human insight. It ensures that every new digital artefact automatically enters the security review cycle, that metrics quantify risk in real time, and that security orchestration ties the findings into the broader defense. By continuously refining this attack surface map and respecting the delicate balance of employee freedom, organizations can stay ahead of adversaries and shrink their exploitable terrain day by day.
